In September 2024, Milliman published a white paper1 analyzing data published by Freddie Mac and Fannie Mae that provided VantageScore 4.0 (Vantage) credit scores on historical loans purchased by Freddie Mac and Fannie Mae. That analysis provided summary statistics on the distribution of mortgages by credit score, the default rates by credit score bin, and insights into how the introduction of Vantage could impact mortgage underwriting and pricing. On July 1, 2026, Freddie Mac and Fannie Mae released FICO Score 10T (FICO 10T) data, enabling market participants to analyze FICO 10T using publicly available data.
This paper updates Milliman’s prior analysis of Vantage using the FICO 10T data and compares the FICO 10T data to the Vantage data. Specifically, this paper provides distributions of credit scores, default rates for FICO 10T, and comparisons between FICO 10T and Vantage. It then evaluates the correlation and information gained from using both scores to determine borrower risk.
Data
This analysis uses loan-level performance and credit score data made publicly available by Fannie Mae and Freddie Mac (the government-sponsored enterprises, or GSEs).2 Milliman filtered the data to only loans that included both a Vantage credit score and FICO 10T credit score. The data used for this analysis comprises:
- Dataset size: 46 million loans
- Origination years covered: 2013 to 2023
The historical loan performance data released by the GSEs, while only a subset of the population, represents a majority of loans originated by Fannie Mae and Freddie Mac over the period analyzed. We compared the totals in the analysis data to those published in Freddie Mac and Fannie Mae’s Mortgage-Backed Securities (MBS) data.3,4 The MBS data tracks monthly payment status, prepayment activity, and ultimate default outcomes for mortgages underlying agency mortgage-backed securities. Prior to filtering the historical performance data, we identified roughly 49 million loans in both datasets. Given the significant degree of overlap between the population level (MBS) and the historical performance datasets (used in the analysis), the results in this analysis effectively represent population-level observations with the caveat that most loans removed during processing (~3 million) were originated under the Home Alternative Refinance Program (HARP).
Fannie Mae did not publish modernized credit scores for loans originated under the HARP program; therefore, we excluded HARP loans from the Freddie Mac data when performing this analysis. Figure 1 provides the number of loans and average credit score by origination year for the loans with both a FICO 10T and Vantage score.
For this analysis, we applied the current methodology used by the GSEs to determine the representative credit score. That is, we used the median of three scores, when three scores are obtained, as reported in the dataset.
Figure 1: FICO 10T and Vantage – number of loans and average score by origination year
| Origination Year | Number of Loans | Average | |
|---|---|---|---|
| FICO 10T | Vantage | ||
| 2013 | 3,121,934 | 768 | 769 |
| 2014 | 2,428,362 | 758 | 759 |
| 2015 | 3,219,023 | 761 | 762 |
| 2016 | 3,956,505 | 762 | 764 |
| 2017 | 3,345,751 | 754 | 755 |
| 2018 | 3,056,372 | 752 | 753 |
| 2019 | 3,984,903 | 759 | 760 |
| 2020 | 8,886,332 | 774 | 777 |
| 2021 | 8,751,539 | 767 | 770 |
| 2022 | 3,377,188 | 754 | 755 |
| 2023 | 1,890,555 | 759 | 758 |
| Total | 46,018,464 | 763 | 765 |
FICO 10T: Range and summary statistics
As with Vantage and Classic FICO, the FICO 10T credit score ranges from 300 to 850. Summary metrics indicate that FICO 10T produced, on average, a slightly lower mean score than Vantage for the same population. When the data is grouped by origination year, this difference in the mean between FICO 10T and Vantage was less than three points across all origination years. While the mean is similar, the distribution across the credit score ranges differs between FICO 10T and Vantage. Figure 2 and 3 show the distribution of credit scores for FICO 10T and Vantage in 20-point increments.
Figure 2: FICO 10T and Vantage – loan distribution by score range
| Credit Score Bin | FICO 10T | Vantage | ||
|---|---|---|---|---|
| # of loans | % share | # of loans | % share | |
| LT 620 | 493,161 | 1.07% | 379,917 | 0.83% |
| 620–639 | 570,359 | 1.24% | 502,757 | 1.09% |
| 640–659 | 1,055,538 | 2.29% | 1,024,265 | 2.23% |
| 660–679 | 1,753,760 | 3.81% | 1,574,470 | 3.42% |
| 680–699 | 2,632,258 | 5.72% | 2,646,137 | 5.75% |
| 700–719 | 3,597,774 | 7.82% | 3,938,291 | 8.56% |
| 720–739 | 4,548,711 | 9.88% | 4,317,274 | 9.38% |
| 740–759 | 5,351,518 | 11.63% | 4,056,066 | 8.81% |
| 760–779 | 5,913,214 | 12.85% | 5,152,250 | 11.20% |
| 780–799 | 6,324,265 | 13.74% | 8,322,000 | 18.08% |
| 800–819 | 6,066,576 | 13.18% | 6,991,940 | 15.19% |
| 820–839 | 4,899,655 | 10.65% | 5,653,529 | 12.29% |
| 840–850 | 2,811,675 | 6.11% | 1,459,568 | 3.17% |
| Total | 46,018,464 | 100% | 46,018,464 | 100% |
Figure 3: Loan distribution for FICO 10T and Vantage
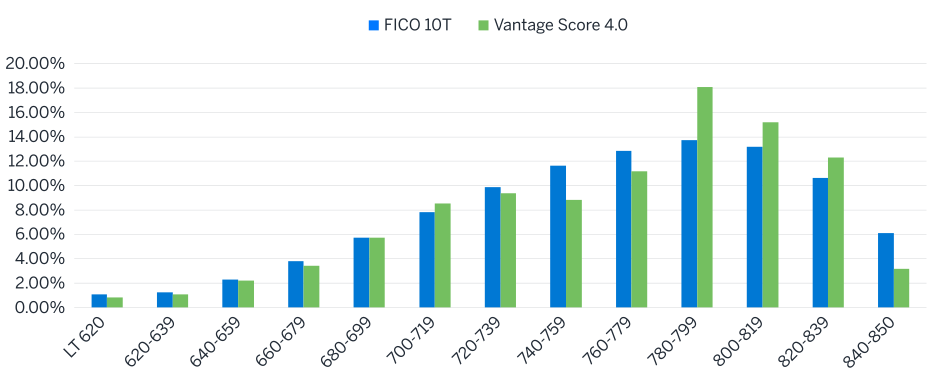
FICO 10T score data had a higher standard deviation relative to Vantage. This means that the distribution of credit scores for FICO 10T was wider than that for Vantage for the scored population. Based on the sample selected, loans had Vantage scores between 383 and 850, while the same loans had FICO 10T scores between 363 and 850.
Without any stratification applied to the loans, the average difference between Vantage and FICO 10T was 0.23% (765/763-1), with Vantage being the higher average of the two. Figure 3 shows the distribution of loans for each credit score. The FICO 10T distribution is a skewed distribution towards higher credit scores with a concentration of loans above 750.
The FICO 10T distribution differed from the bimodal (two-peak) distribution observed under the Vantage model for the same loan population, which exhibited two peaks – one in the 700 to 730 range and one in the 780 to 800 ranges. The Vantage score distribution in this dataset was consistent with distributions we had observed in other datasets from previous analyses.
Both distributions had very few observations with a credit score below 620, representing 1.07% of the entire dataset for FICO 10T and 0.83% for Vantage. This is likely because the data was censored to originations that were purchased by the GSEs when Classic FICO was the only approved credit score model, and the GSEs generally required a credit score of 620 or higher.
We evaluated the distribution in aggregate and by origination year. Figure 4 shows the mean credit score for FICO 10T and Vantage by origination year.
Figure 4: Average credit score for FICO 10T and Vantage by origination year
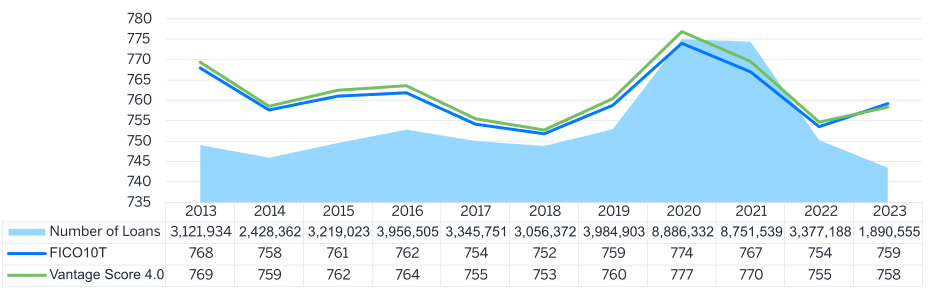
The gap between the average FICO 10T score and the Vantage score was generally consistent across time, with loans originated in 2023 being the only case where FICO 10T had a higher average score.
Correlation between scores
We evaluated the correlation between FICO 10T and Vantage to analyze the extent to which FICO 10T and Vantage score the same borrower similarly. That is, if FICO 10T is high for a borrower, is Vantage high for the same borrower? Correlation is an informative but limited measure. It does not provide insight into mortgage pricing differences between scores, but it does provide some information on how consistent the scores are in producing higher scores for the same borrowers.
The correlation coefficient between scores was 0.85. Although positive, several mortgages had large differences in credit scores. The differences were both positive (meaning the borrower may have both a high credit score under FICO 10T and Vantage) or negative (meaning the borrower may have a high credit score under FICO 10T and a low score under Vantage). Figure 5 shows the score relationship in scatterplot form.
Figure 5: Correlation scatterplot – FICO 10T and Vantage
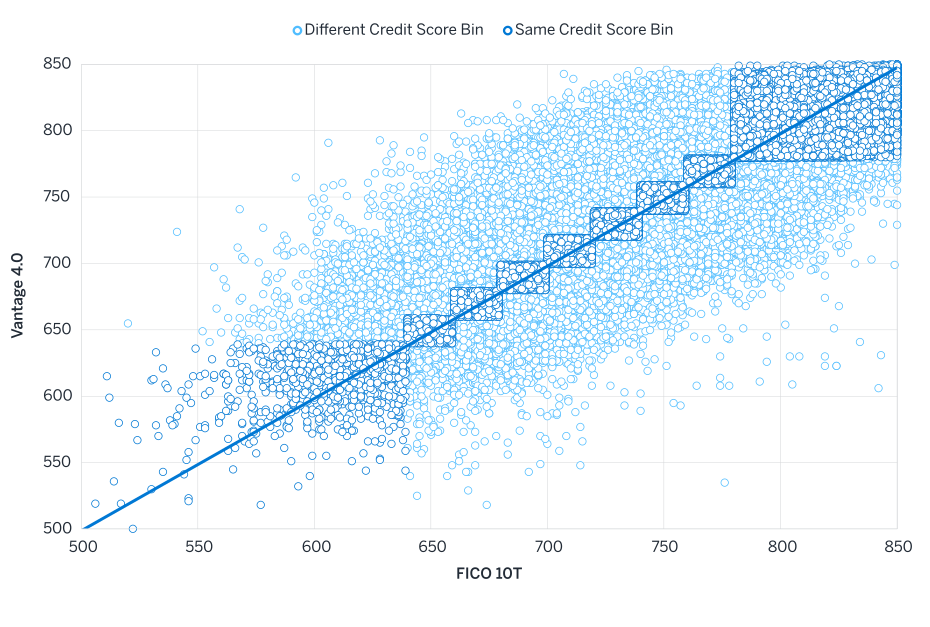
To measure the dispersion between FICO 10T and Vantage, and the potential underwriting implications, we calculated the score separation using the number of loan-level price adjustment (LLPA) credit score bins apart. LLPAs are the GSEs' risk-based pricing fees, tiered by credit score bins. Using these LLPA bins, the share of loans with a separation of one or more bins indicates the proportion that would receive a different pricing adjustment depending on which score model was used. Although this paper did not analyze the directional bias of that dispersion, Figure 6 reveals that nearly half of all loans in the dataset would be affected by this choice; only 51.8% would have received the same LLPA regardless of the score model selected.
Figure 6: Credit score dispersion using LLPA credit score bins – FICO 10T and Vantage
| Number of bins apart | 0 | 1 | 2 | 3 | 4 | 5 | 6 | 7 | 8 |
|---|---|---|---|---|---|---|---|---|---|
| Percentage of loans | 51.82% | 28.75% | 13.07% | 4.55% | 1.32% | 0.35% | 0.10% | 0.03% | 0.01% |
Default rates by credit score model
In this analysis, a default is defined as a loan that was reported as 90 days delinquent or worse, including foreclosure, during the first two years after origination, or a loan that received a modification prior to reaching 90 days delinquent. The reason for including loan modifications in the definition is that mortgage modifications are generally not provided to borrowers unless the borrower can demonstrate financial hardship and has either missed a mortgage payment or will miss one. Note that we analyzed the full data history, including COVID-19. The first section provides default rates for the full history of data, and the second section censors the pandemic period. In 2020, many borrowers went delinquent and received special COVID-19 forbearance; therefore, default rates were elevated in the data after calendar year 2020, and many borrowers may have defaulted due to special forbearance programs offered by the GSEs. Without these programs, some borrowers likely would not have defaulted on their mortgage. It is difficult to evaluate the impact of the special forbearance programs in terms of the number of defaults that would or would not have occurred without such programs.
The observed delinquency rate in the data had a similar shape between FICO 10T and Vantage. Default rates under Vantage were slightly higher on average for upper credit score ranges. Loans assigned a credit score of less than 620 under Vantage experienced a slightly lower default rate (9.37% under FICO 10T compared to 8.62% under Vantage). For credit score ranges greater than 740 (except the 840 to 850 range), FICO 10T had a lower default rate than Vantage.
Figure 7 illustrates the 90-day delinquency rate results for both credit score models.
Figure 7: Default rates by credit score range
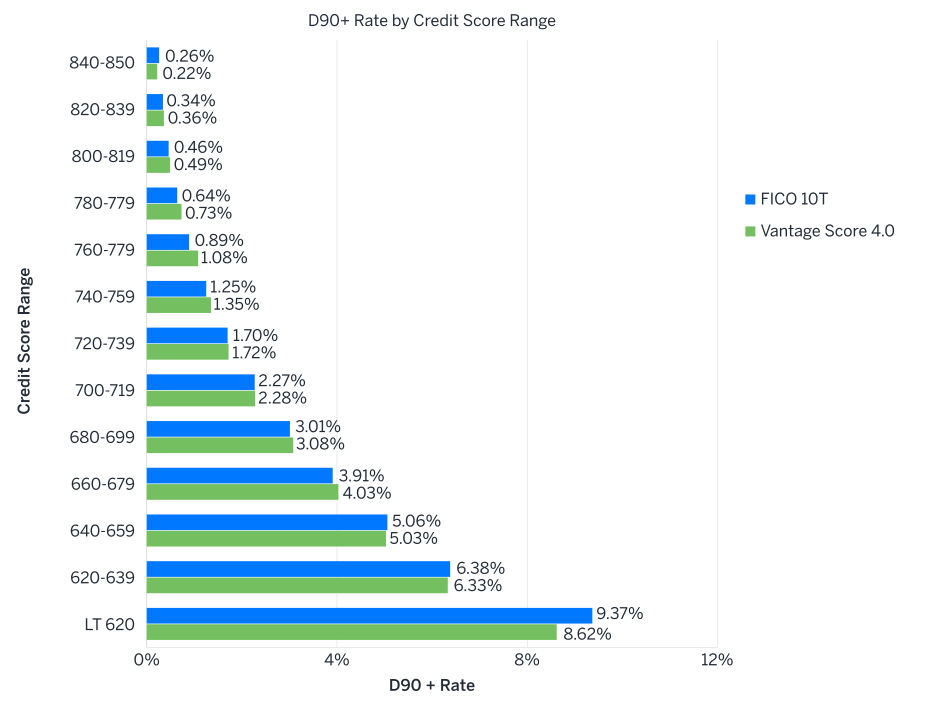
Note that credit score models are designed to identify and separate high-risk borrowers from low-risk borrowers. The stronger model has greater separation in risks and will have higher default rates in the lower scores and lower default rates in higher scores. As an example, a score that is not effective in identifying high-risk borrowers would have the same default rate across the credit score range, as the credit score would not be able to segment high-risk and low-risk borrowers.
Although the default rates appear similar in Figure 7, a key function of credit score models is to segment potential borrowers into low-risk and high-risk groups. That is, it is not only the default rate but also the allocation of consumers within the credit score range that determines the effectiveness of a credit score. Our research has concluded that FICO 10T produces stronger statistical fit statistics relative to Vantage.5
Delinquency rates before COVID-19
To remove the effect of COVID-19 on the default rates calculated in the previous section and generate a “pre-COVID-19” loan sample, the data was filtered to exclude loans that were affected directly by the pandemic. This way, the default rates analyzed excluded the impact of COVID-19-related delinquencies resulting from COVID-19-related forbearance. Figure 8 shows the 90-day delinquency rates by credit score range for both FICO 10T and Vantage using the pre-COVID-19 data sample. Note that the default rates in Figure 8 are materially lower than the default rates in Figure 7, demonstrating the significant impact of COVID-19-related delinquencies in the data.
Figure 8: Default rates by credit score range (pre-COVID-19 sample)
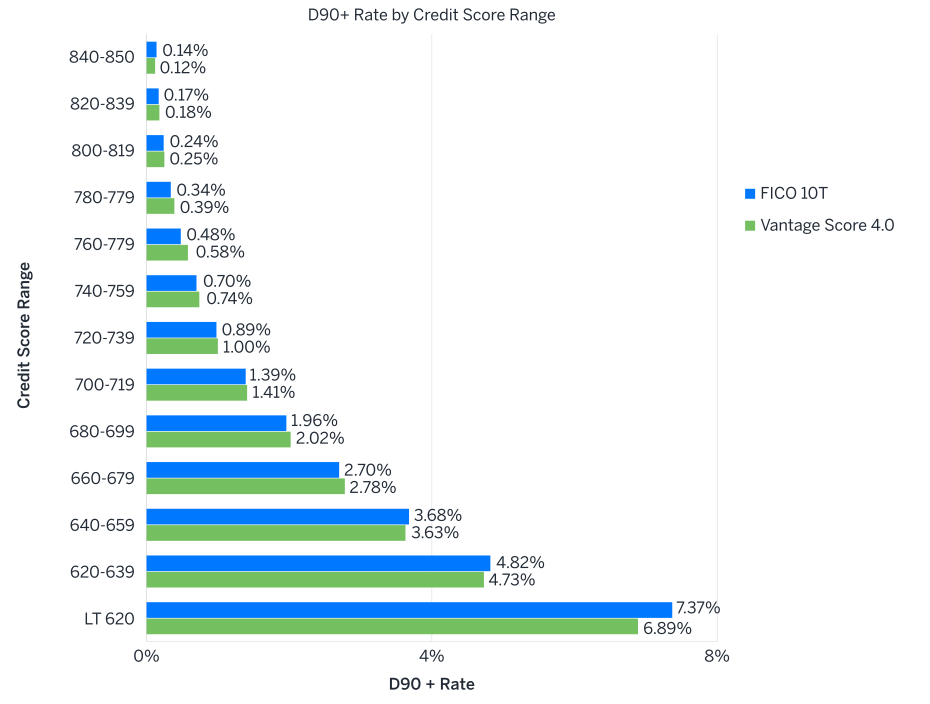
The observed delinquency rates pre-pandemic retained a shape similar to the analysis performed in the previous section. For credit scores above 660, the default rates using Vantage were higher for the same range relative to the FICO 10T default rate, except in the highest credit score range. For credit scores less than 660, the default rates using Vantage were lower for the same range relative to the FICO 10T range.
Default rate by score combination
We evaluated whether information is contained in FICO 10T that is not accounted for in Vantage (and the other way around). In other words, if a borrower scores a FICO 10T of 650 and a Vantage of 750, does that borrower perform differently when compared to a borrower with a FICO 10T of 650 and a Vantage score of 650? From the above default rate analysis, each score produced declining default rates as credit scores increased. This analysis evaluates how borrowers perform given different indications of risk from each score. Figure 9 calculates observed D90 default rates, excluding the COVID-19 data.
From Figure 9, we see that information is gained from both FICO 10T and Vantage. That is, for the same FICO 10T range, observed default rates decreased with higher Vantage scores, and for the same Vantage score range, observed default rates decreased with higher FICO 10T scores. This indicates that both FICO 10T and Vantage had different assessments of borrower creditworthiness at origination.
FICO 10T and Vantage both incorporate trended data, but they weight and process certain variables differently. Nevertheless, they both provide additional predictive information.
Figure 9: Observed default rates by credit score range combination
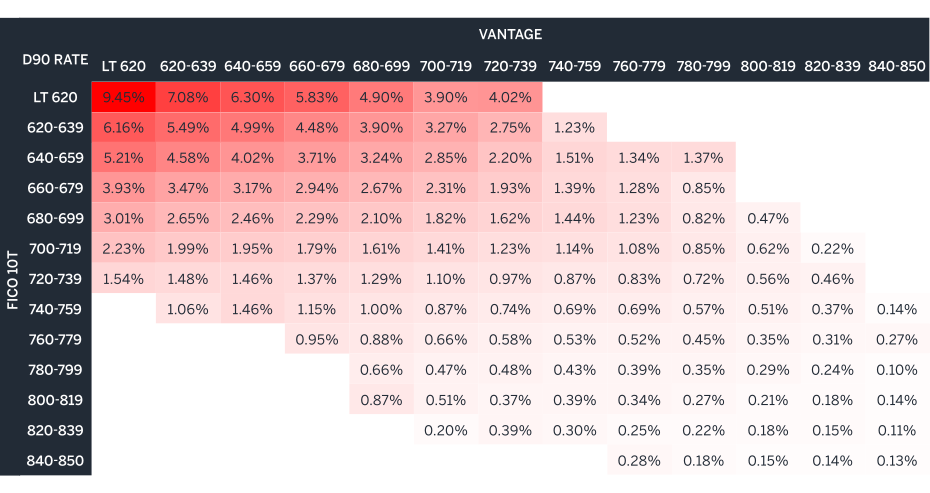
From an underwriting and modeling perspective, this indicates that models that ingest both FICO 10T and Vantage would outperform models that only included one score.
Key takeaways
This analysis compared FICO 10T and Vantage across score distribution, model correlation, and default rate performance. Both models leverage expanded data sources not used in Classic FICO, resulting in meaningful differences in how borrowers are scored. Key points are summarized below:
- FICO 10T is an updated credit score that produced a slightly wider distribution of credit scores relative to Vantage, with a unimodal skewed distribution
- Both credit score models leveraged additional data that was not available when classic FICO was created; therefore, they score borrowers differently because of the added data
- FICO 10T and Vantage were correlated, but there is sufficient divergence between scores to demonstrate they use different signals
- The divergence is significant enough to result in pricing differences for approximately half of the borrowers in the data
- Default rates for Vantage and FICO 10T were both strong models to ordinally rank borrowers from higher to lower credit risk
- The default rates were generally consistent between scores, but caution should be used when integrating FICO 10T or VantageScore directly into existing performance models, as calibration is needed
- FICO 10T and VantageScore are two different models and cannot be used interchangeably; both scores require separate approval thresholds and pricing calibration
- Using both FICO 10T and VantageScore together can improve models’ predictive power in evaluating mortgage default risk
1 Nunez Magana, R. (2024, September 24). Cracking the tape: What you need to know about VantageScore 4.0. Milliman. Retrieved August 7, 2026, from https://www.milliman.com/en/insight/cracking-the-tape-vantage-score-4.
2 Historical credit score files [Dataset]. (2026, July 1). Fannie Mae. Retrieved August 7, 2026, from https://historicalcreditscores.fanniemae.com/.
3 Fannie Mae single-family loan performance data [Datasets]. (2026, July 31). Fannie Mae. Retrieved August 7, 2026, from https://capitalmarkets.fanniemae.com/credit-risk-transfer/single-family-credit-risk-transfer/fannie-mae-single-family-loan-performance-data.
4 Single family loan-level dataset [Dataset]. (n.d.). Freddie Mac. Retrieved August 7, 2026, from https://www.freddiemac.com/research/datasets/sf-loanlevel-dataset.
5 Glowacki, J., Huff, R., & Nunez-Magana, R. (2026, July 7). Analysis of FICO Score 10T and VantageScore 4.0 predictive power using Freddie Mac and Fannie Mae loan-level performance data. Milliman. Retrieved August 7, 2026, from https://www.milliman.com/en/insight/fico-score-10t-vantagescore-4-predictive-power.